Breathe Right: DIY Sensorized Inhaler Tutorial

A deep breath kicks off the respiration process --- oxygen moves through the bronchial tube, into the lungs, and then aveoli for a hand-off to one of 30 trillion blood cells. On the release, we exhale CO2. And then the cycle continues. For healthy people, this stealth exchange of oxygen for CO2 goes unnoticed 15-25 times per minute.
But for 334 million asthmatic patients around the world, the system to process oxygen comes to a screeching halt on a regular basis. Another 65 million people with Chronic Obstructive Pulmonary Disorder (COPD) suffer the same symptoms. Asthma and COPD are chronic respiratory conditions. They are often comorbidities, meaning patients suffering from another serious condition, such as cardiac disease, will also develop COPD as a result of general poor health.
The bright news, modern medicine has developed medication to maintain and treat these respiratory conditions. Regular treatment of inhaling steroid medication from a preventer inhaler builds up a protection over time for the airway system deep inside the lungs. Irritants in the air or a dramatic temperature change can irritate the bronchial airways, triggering a constriction that makes breathing difficult, labored, and sometimes impossible for patients. For these emergency situations a rescue inhaler is used to treat these spontaneous and potentially fatal asthma attacks.
By all accounts, asthma and COPD are self-manageable diseases. Meaning, the medication and drug delivery devices are accessible --- available and affordable.
Yet even today, 94% of inhaler users make mistakes using their device and misdose the maintenance and rescue medication. 62% of patients don’t adhere to their maintenance medication schedules. This prevents the bronchioli in their lungs from developing a resistance against the asthma triggers. The reasons patients misuse or forget to use their inhalers are complex and reflect their individual lifestyle. Sometimes timing a breath to inhale medication is a challenge. Other patients don’t feel bad in the moment and don’t see the immediate impact of skipping a dose of the maintenance inhaler. Sometimes life just happens and people misplace their inhalers.
Whatever the reason, MakerHealth tools and kits give us the resources to take on the challenge of building a personalized inhaler to help you, your family or your patients manage their care. Who better to identify the features needed to improve an inhaler than those who are using it or helping patients to use this every day.
In this tutorial you’ll build a sensorized inhaler to help with medication schedules and device use for patients managing respiratory conditions.
You’ll learn:
The MakerHealth approach to DIY medical device design
Tools and techniques for managing your own data.
How to build a microcontroller stack to add tracking, movement, data-logging, and telemedicine features to an inhaler.
How to design an experiment to collect data for 1 or more inhaler users
How to improve the ergonomics of an inhaler using simple materials

Setup
For this tutorial, we will be using the TinyDuino platform. If you have used Arduino or similar microcontrollers, TinyDuino is a similar system that provides a unique form factor and connection-feature. For those unfamiliar with microcontrollers and Arduino, go to our Getting Started with Microcontrollers tutorial. For this sensorized inhaler tutorial, and other smart health devices, we like the TinyDuino because of its small form factor, ease of assembly, ease of experimenting/tinkering, and re-usability of its parts.
Materials Walkthrough
When you open your kit, you will see the following parts:


Assemble the Sensorized Inhaler Stack

How the system works
Connecting the Electronics boards
TinyDuino electronics use a unique, modular interface that allows the boards to be easily assembled, swapped, and re-used. To assemble the boards, simply snap the male connector from one board into the female connector of another. You’ll notice that the processor will always have to be on the “bottom” of the stack as it only has a female connector, and the display board (screen) will always have to be on the “top” since it only has a male connector.
For your Sensorized Inhaler Stack, you’ll want to make sure the Sensor Board is the second board in the stack. The order should be as follows

Running the Inhaler
Upload the Code
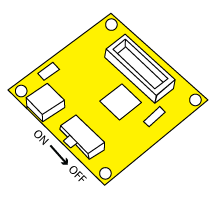
First, make sure that the USB board is in the stack. Next, check the processor to make sure the switch is turned to ON. The switch is small, so you may need to use a pen or similar tool to switch the processor to the ON position.

processor board
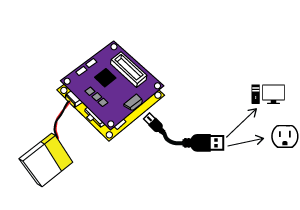
Connect your USB micro cable from the USB board to your computer, you should see an orange light on the USB board turn on which means that the board has connected.
Now that all of the hardware is connected, the next step is to upload code. This code is what makes our electronics "run". Via the code, we can control how the microcontroller processes the inputs and dictates the outputs for the system.
We'll now upload the code to the Sensorized Inhaler stack you just assembled. To upload the code to your Sensorized Inhaler stack, you will use the embedded IDE below (SensorizedInhaler_HallEffect by nalbarran11). In the bottom left corner of the embedded IDE, make sure that TinyDuino is selected from the drop-down menu (Please select a board).
In the drop-down menu to the right of the board menu, you'll see a COM port automatically selected (e.g. COM 1) if your stack is plugged in correctly. If you see "No ports detected" a couple of things could be happening. Either: 1) the processor hasn't been switched ON, 2) the stack is not connected to the computer via USB cable yet, or 3) your board is not being recognized by the computer.
The Code
Connect the Sensor Stack to the Inhaler
Once we upload the code, we don’t need the USB board for our Sensorized Inhaler (until we want to debug using the serial monitor or re-upload new code). Removing the USB board allows us to have a thinner final form factor. First, make sure the processor is shut off (not a big deal, but good practice).
Processor board
Next, disassemble boards to remove the USB board from the stack.

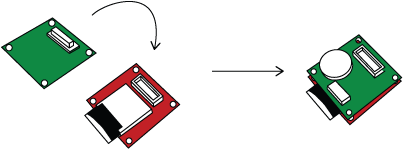
Assemble the stack in the order shown here, again making sure that that the sensor board is second in the stack.

Last, once the board are together, plug the battery in and turn the processor back on. The screen should look like this:

This technique of re-assembly will also work if your boards are to fall apart when being used.
Assemble the Sensorized Inhaler in the Case
In order to ensure that the electronics would fit clean and snug on the back on the inhaler, there is a 3D printed case included in your kit. Beyond aesthetics, CAD modeling and 3D printing gives us greater control over the alignment of the magnet and Hall effect sensor, while allowing us to create a case that is modified to fit specifically to this inhaler. The tutorial on Creating Part Modifications and Add-Ons in CAD walks through various techniques for designing parts that modify or add-on to existing devices/hardware. By clicking on the file name in the 3D Viewers below, you can download the STL files for the parts included in your kit.
With the battery plugged in and the screen turned on, put the Sensor Stack into the 3D Printed case.

Put the case on the back of the inhaler like a backpack.

Put the cap on the inhaler (make sure the sensor and magnet are closely aligned)

When you press down on the cap, the magnet in the inhaler cap will come into range of the Hall effect sensor. Once this happens, you should see the "Last Used: " and "Counter:" information on the screen display update!


Experiment.1
For your first experiment, let’s test if the alignment of the hall effect sensor is correct. Push down on the cap to deliver one dose of medication. When the medication is released, the Sensorized Inhaler Stack screen will display:
Last Used: CURRENT TIME
Counter: 1
Data Analysis and Visualization
Retrieving Data from Inhaler
To retrieve your data from the Sensorized Inhaler, first take the microSD card out of Memory Board, put into microSD adapter, and insert into your computer

Using Excel for Analysis and Visualization
Since we saved our data to a CSV file, the file "datalog.CSV" can be easily opened using Microsoft Excel. Once open, your Excel workbook should look similar to this:

Using the charting features, and a quick manual analysis of the data, you can develop visual graphics displaying pertinent information such as number of uses by day for a given time period.

Later on we will dive into the different parts of the code, including the parts that you can (and should!) modify to customize/hack your inhaler.
Where can you go from here?
This introduction to building a sensorized inhaler allows you to build a system that:
Creates a timestamp when the inhaler is used using a hall effect sensor
Logs this data to a .CSV file stored on a microSD card
Allows you to the data in excel or another graphing software
Allows you to share the data with your family and/or physician
Now that you are certain the sensor is working, the data is logging, your stack is connected to the inhaler, and you've viewed the data collected you are ready to start using your device in the wild! Spending 1 week with your prototype outside of the lab will tell you more than you can learn if you were to spend 3 months inside the lab perfecting your device.
Once you realize what works, what didn’t, and where you want to improve your device, you can start digging into the forked branches of the Breathe Right Tutorial. Explore the deep dive tutorials below to learn ways to expand your inhaler technology stack to track techniques using an accelerometer or to automatically send data from the Sensorized Inhaler Stack to a mobile phone app using App Inventor platform and bluetooth.
Let us know what you create!


Switches + Sensors
Introduction to Switches
In electric circuits, a switch is a device that is used to open and close a connection. In order for an electric circuit to "run", there must be a closed loop, allowing electrons to flow. The first figure below shows a simple circuit consisting of a battery, resistor, switch, and LED (light emitting diode). In its current state, the switch is OPEN, meaning that the loop from the positive end of the battery to the negative end is not connected.

Once the switch is CLOSED, the LED turns on as the circuit is now completed and there is a fully connected path for the electrons to flow from one end of the battery to the other.

There are many different types of switches, as you'll find in your kit. Above is an example of a toggle switch, in this case, meaning that the switch will change between two different positions.
Below is an example of a pushbutton switch. Whereas the above switch acts as a gate, the pushbutton switch acts more closely to a bridge. Both toggle and pushbutton switches can either be momentary, meaning the circuit will only be open or closed for the duration of it being pressed, or can be maintained, where it holds its position until it is manually changed.

push button switch
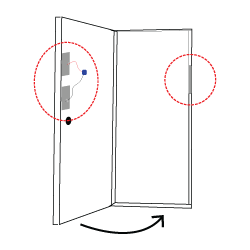
Although the switches act as passive components opening/closing the above circuits, they can also be used as a sensor. These simple switches primarily have two states, (OPEN and CLOSED), which makes them great for scenarios where we want to detect the state of a simple mechanism or system. For example, let's say we wanted to detect the status of a door. Like a switch, the door has two possible states. If we take the copper switch we just diagrammed and apply it to a doorway, we can create a custom switch sensor that detects the state of the door. We do this by "reading" the voltage, the difference in charge between two points, across the switch.
contact switch
Hall Effect Sensors
For our inhaler, we are going to use a sensor known as a Hall effect sensor as a switch that we can then read. A Hall effect sensor works by measuring the voltage across a conductive plate, named the Hall voltage after Edwin Hall . In the below diagram, the circular component is connected to the two different sides of the plate. Initially, with no magnet present, there is a small electric potential difference between the two sides since the positive and negative particles are randomly spread across the plate. When the magnet comes within range of the plate, the magnetic field causes the particles to separate across the plate. With positive particles on one side of the plate, and negative particles on the other, there is a measurable voltage.

hall effect sensor
The first switches we learned about required physical contact to be actuated. As shown in the Hall effect diagram, the sensor is being actuated by the magnet, which needs to be in range, but does not require physical contact. For our inhaler, we will use the Hall effect sensor to measure the pressing down on the canister. There are a couple of reasons why we use this sensor instead of a traditional switch:
Since there is no physical contact required, the switch is effectively wireless and allows us to measure the movement of the canister without having to attach wires to it.
To create the Hall voltage, the magnet needs to be within a specified range of the sensor. This means that there is some room for error when assembling the system since we do not rely on precise alignment to measure the canister's movement. Therefore, when we design and create a case, the dimensions are a lot more forgiving.
When dealing with physical switches, the contact pads can wear down over time, contact issues can arise, and there may even be false connections being detected. Again, the Hall effect sensor avoids these potential downfalls since there it is not physically actuated.
While there aren't physical contact factors to take into account when assembling Hall effect switch, there are still two main design factors we must consider when designing a case. First, we need to make sure that the sensor and magnet are vertically aligned. If the magnet is too far off center, then the Hall effect sensor will not be able to accurately read it.

The second factor we need to take into account is the rest height (ho) and actuated height (hc) of the sensor and magnet. We want to position the magnet such that in its rest position (when the inhaler canister is unpressed), the Hall effect sensor is not actuated and when the canister is pressed, the height between the magnet and sensor is short enough that the magnet actuates the sensor.
"Reading" the Switch
In order for our Hall effect sensor to be useful, we will need to "read" the state of the sensor. As discussed in our Getting Started with Arduino tutorial, it is most effective to use a digital pin to to this, since there are only two states we are concerned with. First, we define pin 5 as our Hall effect sensor pin (hallPin) and create a variable called statePin to hold the state of the hallPin once it is read.
const int hallPin = 5;  // Input pin for touch state
int statePin;
In the void loop() we use digitalRead to read the state of the Hall effect sensor pin. For the sensorized inhaler, the digitalRead will read LOW when the hall effect sensor is actuated, so our if statement is triggered by that condition.
  statePin = digitalRead(hallPin);
  Serial.println("State: ");
  Serial.print(statePin);

  if (statePin == LOW){
Going Beyond Use Counting
With the Hall effect sensor, we can accurately track when the user uses the inhaler and subsequently, the history of their usage. However, when analyzing inhaler usage, there are various other factors that we may want to consider and to measure these we need to go beyond the limitations of the Hall effect sensor. Other relevant factors when analyzing inhalers include:
Location (GPS Tracking and Bluetooth Communication)- Is it important to know when a user enters an area known for strenuous breathing conditions? In addition to when someone uses an inhaler, is it important to also note where they use it in order to get a more complete picture of usage patterns?
Pre-Use Condition (Accelerometer)- Does the inhaler need to be shaken before use? By using an accelerometer we can display notifications/alerts to the user if they forget to shake their inhaler before use.
Proper Usage (Capacitive Touch Sensor)- Oftentimes, users will use their inhaler too quickly, and thus, won't receive the adequate dosage. We can use a capacitive touch sensor in conjunction with the Hall effect sensor to better understand if the inhaler is being used properly.
Data Logging
RTC
Like many quartz clocks and watches, a real time clock (RTC) uses a crystal oscillator to keep time. Unlike the millis() function and library that initiates only when the microcontroller is turned on, a RTC usually has a separate power source that allows it to run even when not being powered by the main circuit.
In the void setup() loop there are two main functions related to the RTC. The first, RTC.start, initializes the RTC in the sketch. The second, set_time(), allows you to set the time the first time you upload your program. As you may have noticed in the code, this line is actually commented out right now. That’s because the RTC should already be set with the correct time and should not need to be updated since it is being kept on its own power source! If you do need to update or change the time, simply uncomment this line in the sketch before uploading your code.
Once the code is uploaded to the board, you will be prompted by the Serial Monitor to enter the date and time. Now that the time is correctly set, you can go back in and comment out that line again and re-upload the code, otherwise, our sketch would get hung up on the set_time() function every time you turned the system back on!
  //Initialize RTC
  RTC.start();
  //set_time();  // **COMMENT OUT THIS LINE AFTER YOU SET THE TIME**
Here, we have created a function, currentTime(), where we will retrieve the time from the RTC and then return the formatted time anytime the function is called. By creating a separate function to do this, we make it easier to call on the correctly formatted time in the void loop(). We will use the void currentTime function to return two strings, nowDate (the date formatted as month/day/year) and nowTime (the time formatted as hh:mm:ss).
The first function RTC.readTime() grabs all the values we will need from RTC. The following two lines are separate strings, one for the formatted date, and one for the time. Using the various RTC.get functions, we can easily construct the date and time strings with their own formatting.
void currentTime(String &nowDate, String &nowTime){
   RTC.readTime();
   nowDate = String(int(RTC.getMonths())) + "/" + String (int(RTC.getDays())) + "/" + String(RTC.getYears()-2000);
   nowTime = String(int(RTC.getHours())) + ":" + String(int(RTC.getMinutes())) + ":" + String(int(RTC.getSeconds()));
}
Since there is a separate function that is retrieving and formatting the time, once we are in the void loop(), all we need to do is call on that function to return the formatted time (code lines 175-178). These strings will help us timestamp the data when we log it to the SD card in the next section.
  String ahoraDate;
  String ahoraTime;
  currentTime(ahoraDate, ahoraTime);
  String ahora = ahoraDate + "  " + ahoraTime;
The following functions in the sketch are back-end functions for the RTC that shouldn’t be modified. These functions effectively allow RTC to read the time we input into the serial monitor.
int read_int(char sep)

int read_int(int numbytes)

int read_date(int *year, int *month, int *day, int *hour, int* minute, int* second)

void set_time()

void read_time()

void printTime(byte type)
microSD
Now that we know how to timestamp the data coming from our sensorized inhaler, the last step is to actually log and save the data somewhere where we can easily access it later on.
The first step to setting up the SD card data logging is to initialize the SD card and the file we will save our data to. Lines 47-55 are used to make sure our microcontroller recognizes the SD card and if so, initialize it. In line 59, we can name the file that we want to create to save the data. To make the data easier to read once we're ready to analyze it, you'll notice that we are creating a file called datalog.csv. We use the CSV (comma-separated values) format since it allows us to easily pull the data into Excel where we can graph, chart, and analyze it. In the next line, line 60, we open up our file for the first time. Remember, the void setup() function is only run once at the beginning of the sketch. Since we are saving as a CSV file, we want to name the columns of the data that is to be saved. Since the void setup() function is only run at the beginning of the sketch, we can name our columns by writing headers for them here. In line 62, the dataFile.println() function is used to print a line in our file containing “Date, Time, Count”. Since this is a CSV file, the commas are used to separate the information we are writing, thus, each of Data, Time, and Count are printed to their own column. In this case, we are going to be going three variables each time: the current date, current time, and the # of times the inhaler has been used. If we wanted to record more variables, we could simply add another column name separated by a comma. For example, if we were to record temperature as well, line 62 would look like: dataFile.println("Date, Time, Count, Temperature");
  //Initialize SD
  Serial.print("Initializing SD card...");

  // see if the card is present and can be initialized:
  if (!SD.begin(chipSelect)) {
    Serial.println("Card failed, or not present");
    // don't do anything more:
    return;
  }
  Serial.println("card initialized.");

    // open the file. note that only one file can be open at a time,
  // so you have to close this one before opening another.
  File dataFile = SD.open("datalog.csv", FILE_WRITE);
  if (dataFile){
    dataFile.println("......................");
    dataFile.println("Date, Time, Count");
    dataFile.close();
  }
  else
  {
    Serial.println("Couldn't open data file");
    return;
  }
The majority of the data logging is going to happen in the void loop() function since that is where we are using the microcontroller to process the inputs from the Hall effect sensor. For our sensorized inhaler, the void loop() is broken up into two main parts, an if statement that is triggered when a press is detected and the normal rest state when it is not being used. This gives us two options for logging: 1) log data within the if statement, meaning data is only recorded when the inhaler is used or 2) log every time the sketch runs through the void loop(). Since the processor will run through the void loop() tens, if not hundreds, or times a second when the inhaler is in its normal state, we are going to avoid #2, since we would be left with thousands of data points, many of which were not providing useful information. By logging data within the if statement, we limit our data recording to only the significant events, in this case, the pressing of the inhaler canister. As such, you’ll notice that the section of code starting with //Logging is inside of the if (statePin === LOW) statement.
Remember back to the void setup() function where we named date, time, and count as the three variables we were going to save. We find the easiest way to organize the data we are going to log is to use a string, in this case dataString. In line 187, you’ll see that dataString is created using three variables ahoraDate (date), ahoraTime (time), and counter (count) and separated by commas. If we follow the example used above and wanted to add temperature to the data we’re recording, line 187 would look like: dataString = String(ahoraDate) + ", " + String(ahoraTime) + ", " + String(counter) + “, “ String(temperature);
Now that we’ve defined the dataString that we want to log, the last step is to write it to the SD card. Similarly to how we print information to the serial monitor, we can actually “print” (or write) information to the SD card using dataFile.println. Because we created the dataString earlier, all we need to do in line 192 is print that dataString to the SD card. Instead of having the tweak this function when we want to add or subtract more variables to record, we can simply manipulate the dataString as demonstrated above.
  if (statePin == LOW){
    //Logging
    String dataString = "";
    dataString = String(ahoraDate)  + ", " + String(ahoraTime)  + ", "  + String(counter);
    // if the file is available, write to it:
    File dataFile = SD.open("datalog.csv", FILE_WRITE);
    if(dataFile)
    {
      dataFile.println(dataString);
      dataFile.close();
Delays
Towards the end of the void loop() in line 204, you'll see the following delay function (measured in milliseconds):
    delay(7000);
    counter++;
this delay function allows us to set a pre-specified amount of time between counted "uses" by the inhaler user. This is to avoid any potential false positives after the inhaler is pressed/used. For the example, the delay is set to 7000 milliseconds, or 7 seconds. This is probably overkill, but 7 seconds ensures that the inhaler won't count twice or more when the inhaler is pressed only once. If you find that this delay is too long or too short, simply change the number inside of the function and re-upload the code!
Screen/Displays
The TinyDuino system allows us to easily include a variety of different displays into our project. For the sensorized inhaler, we are going to use the OLED Screen so that we can easily communicate text information, messages, alerts, and reminders to the user. The use the OLED we need to make sure that we define the TinyScreen display as TinyScreen(0) on line 36.
//Screen Setup
TinyScreen display = TinyScreen(0);
Within the main void loop(), we want to upload the screen every time the inhaler is used to provide visual feedback to the user of the last time the inhaler was used and how many times it has been used. Before we print any text or variables to the display, we need to use setFont() and fontColor() to tell the display which font and font colors to use. Next, we need to set the "cursor" so the display knows where on the screen (x,y position) to display the information. The display will use this font and font color until they are explicitly updated.
      //Screen Display Settings + Text
      display.fontColor(YELLOW,BLACK);
      display.setFont(liberationSans_8ptFontInfo);
      display.setCursor(0,0);
      display.print("Last Used:");
      display.setCursor(0,10);
      display.print(ahora);
      display.setCursor(0,30);
      display.print("Counter: ");
      display.print(counter);
For this example, we are using the screen display for passive information delivery to the user. Using the functions above and others included below, there is a wide range of options for information, reminders, alerts, and messages that can be passed along to the user via the screen.
The screen display is 96 pixels wide by 64 pixels tall and oriented as shown below:

Useful Functions for the TinyScreen Display:
display.setCursor(x-coordinate, y-coordinate) - sets the "cursor" to that pixel on the screen, content being displayed after this line will start at that point
display.fontColor(Text Color, Background Color)- sets the font color and background, any following display text will use the set font and background color until it is changed
display.clearWindow(x initial, y initial, width, height) – Clears a specific part of the screen starting at x,y and expanding by the specified width and height
display.clearScreen() – Clears the whole display
Maintenance
Charging the battery
To charge the battery, first make sure that the processor board (yellow) is turned off.

processor Board
You'll need at least the USB board connected to the processor (charging will still work if additional boards are attached).
With the battery plugged into the processor board, connect a USB micro cable from the USB board to either a computer or wall adapter.
An orange light on the side of the board will turn on while charging. When the orange light turns off, the battery is fully charged.
